簡介
ScottPlot 是一個免費開源的資料視覺化控制項,使用 C# 語言編寫。它可以輕鬆實現巨量資料視覺化互動。ScottPlot Cookbook 範例中,教我們如何用幾行程式碼建立線條圖、直方圖、餅狀圖、散點圖。
ScottPlot Cookbooks 學習如何使用 ScottPlot。
ScottPlot Demo 看看 ScottPlot 能做什麼。
Quickstart:
- Console Application
- Windows Forms
- WPF
- WinUI
- MAUI
- Uno Platform
- Avalonia
- Eto
- .NET Core API
- Blazor WASM
- PowerShell
- .NET Notebook
- IronPython

原始碼框架
用 100 萬浮點數實測,操作順暢如絲,圖不欺我!太酷了吧!那我們趕緊來看看,這是怎麼做到的呢?
下載原始碼:GitHub - ScottPlot
原始碼目錄分析
打開下載好的原始碼,在 scr 中有兩個版本,我們看穩定版的 ScottPlot4(./ScottPlot/src/ScottPlot4/)。(站長註:作者原文寫於 2022 年,目前 2024 年 10 月 31 日 5.X 版本已上線 1 年多,可放心使用)
ScottPlot4 的目錄中有 WinForms、WPF 這些 .NET 架構的東西,可以把它們當作 ScottPlot 的一個外殼。
ScottPlot 目錄是此控制項的核心目錄。
以下是精簡版的 ScottPlot 目錄:
ScottPlot/
├── AxisLimits.cs
├── Coordinate.cs
├── Control
│   ├── Backend.cs
│   ├── Configuration.cs
│   ├── DisplayScale.cs
│   └── EventProcess
│       ├── EventFactory.cs
│       ├── Events
│       │   ├── RenderHighQuality.cs
│       │   └── RenderLowQuality.cs
│       ├── EventsProcessor.cs
│       └── IUIEvent.cs
├── Drawing
│   ├── Font.cs
│   ├── GDI.cs
│   ├── Palette.cs
│   └── Tools.cs
├── Plot
│   ├── Plot.Add.cs
│   ├── Plot.Axis.cs
│   ├── Plot.cs
│   ├── Plot.Obsolete.cs
│   └── Plot.Render.cs
├── PlotDimensions.cs
├── Plottable
│   ├── AxisLine.cs
│   ├── Image.cs
│   ├── IPlottable.cs
│   ├── MinMaxSearchStrategies
│   │   ├── IMinMaxSearchStrategy.cs
│   │   ├── LinearDoubleOnlyMinMaxStrategy.cs
│   │   ├── LinearFastDoubleMinMaxSearchStrategy.cs
│   │   ├── LinearMinMaxSearchStrategy.cs
│   │   └── SegmentedTreeMinMaxSearchStrategy.cs
│   ├── PiePlot.cs
│   ├── Polygon.cs
│   ├── ScatterPlot.cs
│   ├── SignalPlotBase.cs
│   ├── SignalPlot.cs
│   └──SignalPlotXY.cs
├── README.md
├── Renderable
│   ├── Axis.cs
│   ├── AxisDimensions.cs
│   ├── AxisLabel.cs
│   ├── AxisLine.cs
│   └── IRenderable.cs
基本概念
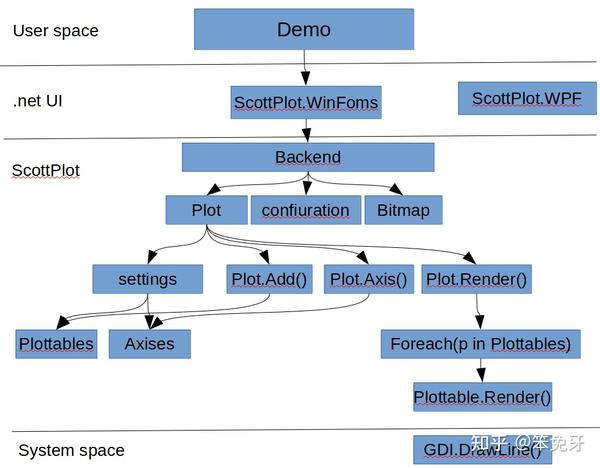
基於以上目錄,從上到下順序分析:
Control/Backend.cs   	   ----> 後台管理,資料,設定,事件相關
Drawing/GDI.cs		   ----> 底層繪圖介面
Plot/Plot.cs    	   ----> 控制項 API,面向使用者
Plottable/IPlottable.cs    ----> 可以繪製的元件
Renderable/IRenderable.cs  ----> 可以渲染的元件
由此看來 ScottPlot 目錄的結構還是很清晰的。掌握了這些基本概念,閱讀原始碼就輕鬆多了。
來一張圖總結:
原始碼分析入口點
因為 Demo 用的是 WinForm,所以我們看 ScottPlot.WinForms/FormsPlot.cs,以此為原始碼分析的入口點。
class FormsPlot : UserControl
{
  public FormsPlot()
    {
        Backend = new Control.ControlBackEnd(1, 1, "FormsPlot");
        Backend.Resize(Width, Height, useDelayedRendering: false);
        Backend.BitmapChanged += new EventHandler(OnBitmapChanged);
        Backend.BitmapUpdated += new EventHandler(OnBitmapUpdated);
        Backend.CursorChanged += new EventHandler(OnCursorChanged);
        Backend.RightClicked += new EventHandler(OnRightClicked);
        Backend.LeftClicked += new EventHandler(OnLeftClicked);
        Backend.LeftClickedPlottable += new EventHandler(OnLeftClickedPlottable);
        Backend.AxesChanged += new EventHandler(OnAxesChanged);
        Backend.PlottableDragged += new EventHandler(OnPlottableDragged);
        Backend.PlottableDropped += new EventHandler(OnPlottableDropped);
        Configuration = Backend.Configuration;
    }
}
在 FormsPlot 建構時,建立後台管理 Backend,並向 Backend 中註冊代理事件,因此 Backend 的事件由 FormsPlot 來接管。配置也使用 Backend 中的配置。
後台管理
/Control/Backend.cs
public ControlBackEnd(float width, float height, string name = "UnamedControl")
{
    Cursor = Configuration.DefaultCursor; //滑鼠樣式
    EventFactory = new UIEventFactory(Configuration, Settings, Plot); //事件建構器
    EventsProcessor = new EventsProcessor(
        renderAction: (lowQuality) => Render(lowQuality),
        renderDelay: (int)Configuration.ScrollWheelZoomHighQualityDelay); //執行事件
    ControlName = name;
    Reset(width, height);// 此時是 width = 1,height =1,主要用於建立 Plot 執行個體
}
/// <summary>
/// Reset the back-end by creating an entirely new plot of the given dimensions
/// </summary>
public void Reset(float width, float height) => Reset(width, height, new Plot());
在這個地方建立 Plot 執行個體,感覺還是有點奇怪。是為了同一張圖片對應多個 Plot 嗎?知道的人留個言吧!
/Control/Backend.cs
public void Reset(float width, float height, Plot newPlot)
{
    Plot = newPlot;
    Settings = Plot.GetSettings(false);
    EventFactory = new UIEventFactory(Configuration, Settings, Plot);
    WasManuallyRendered = false;
    Resize(width, height, useDelayedRendering: false);
}
public void Resize(float width, float height, bool useDelayedRendering)
{
    // Disposing a Bitmap the GUI is displaying will cause an exception.
    // Keep track of old bitmaps so they can be disposed of later.
    OldBitmaps.Enqueue(Bmp);
    Bmp = new System.Drawing.Bitmap((int)width, (int)height);
    BitmapRenderCount = 0;

    if (useDelayedRendering)
        RenderRequest(RenderType.HighQualityDelayed);
    else
        Render();
}
建立用於繪圖的 Bitmap,之前的 Bitmap 被放入 Old 佇列中。Bitmap 大小是由 FormsPlot 建構時 Backend.Resize() 決定。有了 Bitmap 之後就可以在上面繪圖了。
ScottPlot 元件
在看 Render() 這個函式實作前,還是先把關於繪製元件的概念理解更深入一些。
Plot 控制項 API
Plot 為控制項 API,面向使用者。
1) Plot 建構
所有的配置都在 settings 裡面
private readonly Settings settings = new Settings();
最終,使用者設定都保存在 Plot 的 settings 中。
2) 設定 x,y 軸大小範圍
/Plot/Plot.Axis.cs
public void SetAxisLimits(double? xMin = null, double? xMax = null,double? yMin = null,
    double? yMax = null,int xAxisIndex = 0, int yAxisIndex = 0)
{
     //1)Plot/Plot.cs的settings
     settings.AxisSet(xMin, xMax, yMin, yMax, xAxisIndex, yAxisIndex);
}
3) 增加一個 Y 軸訊號
/Plot/Plot.Add.cs
public SignalPlot AddSignal(double[] ys, double sampleRate = 1, Color? color = null, string label = null)
{
    SignalPlot signal = new SignalPlot()
    {
        Ys = ys,
        SampleRate = sampleRate, //渲染時,將用到取樣速度
        Color = color ?? settings.GetNextColor(),
        Label = label,

        // TODO: FIX THIS!!!
        MinRenderIndex = 0,
        MaxRenderIndex = ys.Length - 1,
    };
    Add(signal);
    return signal
}
public void Add(IPlottable plottable)
{
    settings.Plottables.Add(plottable);
}
此處的 SignalPlot 為一個 Plottable 物件,即把要顯示的 100 萬資料打包成可繪製的物件,
並呼叫 Add() 把此物件放入 settings.Plottables 中。settings.Plottables 中存放所有要繪製的物件。
4) 渲染函式
/Plot/Plot.Render.cs
public interface IPlottable
{
    /// <summary>
    /// Controls whether the plot will be rendered and contribute to automatic axis limit detection
    /// </summary>
    bool IsVisible { get; set; }

    /// <summary>
    /// Index of the horizontal axis this plottable will use for coordinate/pixel conversions.
    /// 0 is the bottom axis, 1 is the top axis, and higher numbers are additional custom axes.
    /// </summary>
    int XAxisIndex { get; set; }

    /// <summary>
    /// Index of the vertical axis this plottable will use for coordinate/pixel conversions.
    /// 0 is the left axis, 1 is the right axis, and higher numbers are additional custom axes.
    /// </summary>
    int YAxisIndex { get; set; }

    /// <summary>
    /// This is called when it is time to draw the plottable on the canvas.
    /// </summary>
    /// <param name="dims">Spatial information about the plot and all axes to assist with coordinate/pixel conversions.</param>
    /// <param name="bmp">The image on which this plottable will be drawn.</param>
    /// <param name="lowQuality">If true, disable anti-aliased lines and text to achieve faster rendering.</param>
    void Render(PlotDimensions dims, System.Drawing.Bitmap bmp, bool lowQuality = false);
}
當更新 Bitmap 事件產生時,將透過 Plot.Render.cs:RenderPlottables() 函式,呼叫 settings.Plottables 中所有物件的 Render()。
/Plot/Plot.Render.cs
private void RenderPlottables(Bitmap bmp, bool lowQuality, double scaleFactor)
{
    foreach (var plottable in settings.Plottables)
   {
      if (plottable.IsVisible == false)
           continue;
      plottable.Render(dims, bmp, lowQuality);
   }
 }
Renderable
public interface IRenderable
{
    bool IsVisible { get; set; }
    void Render(PlotDimensions dims, Bitmap bmp, bool lowQuality = false);
}
從介面定義可以看出,與 IPlottable 相似,很有可能是舊程式碼。
SignalPlot 渲染演算法分析
如何將 100 萬資料顯示到圖片上,且在滑鼠移動放大時保持順暢手感呢?其設計思想很簡單,那就是對 100 萬資料按 x 軸解析度進行取樣。
SignalPlot 繼承自 SignalPlotBase,但未覆寫 Render()。因此,當 Plottable.Render() 被呼叫,即呼叫 SignalPlotBase 的 Render()。
/Plottable/SignalPlotBase.cs
public virtual void Render(PlotDimensions dims, Bitmap bmp, bool lowQuality = false)
{
   //之前 AddSignal() 中初始化 _SamplePeriod = 1/SampleRata
   double dataSpanUnits = _Ys.Length * _SamplePeriod;
   double columnSpanUnits = dims.XSpan / dims.DataWidth;
   //x軸中每個間隔中包含的 Y 資料個數
   double columnPointCount = (columnSpanUnits / dataSpanUnits) * _Ys.Length;
   //OffsetX 圖片左上原點到資料顯示區的偏移
   double offsetUnits = dims.XMin - OffsetX;
   double offsetPoints = offsetUnits / _SamplePeriod;
   int visibleIndex1 = (int)(offsetPoints);
   int visibleIndex2 = (int)(offsetPoints + columnPointCount * (dims.DataWidth + 1));
   int visiblePointCount = visibleIndex2 - visibleIndex1;
   //x軸中每個間隔中包含的點個數
   double pointsPerPixelColumn = visiblePointCount / dims.DataWidth;
   double dataWidthPx2 = visibleIndex2 - visibleIndex1 + 2;
   bool densityLevelsAvailable = DensityLevelCount > 0 && pointsPerPixelColumn > DensityLevelCount;
   double firstPointX = dims.GetPixelX(OffsetX);//轉換成像素點
   double lastPointX = dims.GetPixelX(_SamplePeriod * (_Ys.Length - 1) + OffsetX);
   double dataWidthPx = lastPointX - firstPointX;
   double columnsWithData = Math.Min(dataWidthPx, dataWidthPx2);

   if (columnsWithData < 1 && Ys.Length > 1)
   {
      RenderSingleLine(dims, gfx, penHD);
    }
    else if (pointsPerPixelColumn > 1 && Ys.Length > 1)
    {
      if (densityLevelsAvailable)
          RenderHighDensityDistributionParallel(dims, gfx, offsetPoints, columnPointCount);
      else
	 //資料多時呼叫此函式
         RenderHighDensity(dims, gfx, offsetPoints, columnPointCount, penHD);
    }
    else
    {
        RenderLowDensity(dims, gfx, visibleIndex1, visibleIndex2, brush, penLD, penHD);
    }
}

private void RenderHighDensity(PlotDimensions dims, Graphics gfx, double offsetPoints, double columnPointCount, Pen penHD)
{
    int dataColumnFirst = (int)Math.Ceiling((-1 - offsetPoints + MinRenderIndex) / columnPointCount - 1);
    int dataColumnLast = (int)Math.Ceiling((MaxRenderIndex - offsetPoints) / columnPointCount);

    var columns = Enumerable.Range(dataColumnFirst, dataColumnLast - dataColumnFirst);

    //序列同步方式,對 x 軸每一列中的 Y 資料進行計算(取最大最小值)
    intervals = columns
          .Select(xPx => CalcInterval(xPx, offsetPoints, columnPointCount, dims));

    PointF[] linePoints = intervals
          .SelectMany(c => c.GetPoints())
          .ToArray();

    for (int i = 0; i < linePoints.Length; i++)
        linePoints[i].X += dims.DataOffsetX;

    if (linePoints.Length > 0)
    {
        ValidatePoints(linePoints);
        gfx.DrawLines(penHD, linePoints);
    }
}

//取最大值,最小值
private IntervalMinMax CalcInterval(int xPx, double offsetPoints, double columnPointCount, PlotDimensions dims)
{
    // get the min and max value for this column
    Strategy.MinMaxRangeQuery(index1, index2, out double lowestValue, out double highestValue);

    float yPxHigh = dims.GetPixelY(lowestValue + OffsetYAsDouble);
    float yPxLow = dims.GetPixelY(highestValue + OffsetYAsDouble);
    return new IntervalMinMax(xPx, yPxLow, yPxHigh);
}
用 GetPoints() 交替取最大值,最小值
private class IntervalMinMax
{
    public float x;
    public float Min;
    public float Max;
    public IntervalMinMax(float x, float Min, float Max)
    {
        this.x = x;
        this.Min = Min;
        this.Max = Max;
     }
    public IEnumerable<PointF> GetPoints()
    {
	//交替取最大值,最小值
        yield return new PointF(x, Min);
        yield return new PointF(x, Max);
    }
}
查找最大最小值策略
原始碼中有三種策略,可以提前計算,也可動態計算。
/Plottable/MinMaxSearchStrategy/IMinMaxSearchStrategy.cs
public interface IMinMaxSearchStrategy<T>
{
    T[] SourceArray { get; set; }
    void MinMaxRangeQuery(int l, int r, out double lowestValue, out double highestValue);
    void updateElement(int index, T newValue);
    void updateRange(int from, int to, T[] newData, int fromData = 0);
    double SourceElement(int index);
}
/Plottable/MinMaxSearchStrategy/LinearDoubleOnlyMinMaxStrateg.cs
public void MinMaxRangeQuery(int l, int r, out double lowestValue, out double highestValue)
{
    lowestValue = sourceArray[l];
     highestValue = sourceArray[l];
     for (int i = l; i <= r; i++)
     {
	if (sourceArray[i] < lowestValue)
		lowestValue = sourceArray[i];
	if (sourceArray[i] > highestValue)
		highestValue = sourceArray[i];
      }
}
事件
不同的事件,執行不同的 ProcessEvent()。與 Plottable 型別設計思想相同。
當偵測到事件,用 UIEventFactory 中的方法建構對應的 Event。
/Control/EventProcess/Events/IUIEvent.cs
public interface IUIEvent
{
   public RenderType RenderType { get; }
   void ProcessEvent();
}
/Control/EventProcess/Events/MouseZoomEvent.cs
public void ProcessEvent()
{
   float x = Input.ShiftDown ? Settings.MouseDownX : Input.X;
   float y = Input.CtrlDown ? Settings.MouseDownY : Input.Y;
   Settings.MouseZoom(x, y);
}
事件執行流程
首先,是 FormsPlot.cs 中的 PictureBox1 接收滑鼠事件。
然後,呼叫 Backend.MouseMove()。
最後,呼叫事件對應的 ProcessEvent()。
/ScottPlot.WinForms/FormsPlot.cs
private void PictureBox1_MouseMove(object sender, MouseEventArgs e)
{
    Backend.MouseMove(GetInputState(e)); base.OnMouseMove(e);
}
public void MouseMove(InputState input)
{
     mouseMoveEvent = EventFactory.CreateMouseZoom(input);
     ProcessEvent(mouseMoveEvent);
}
結束
ScottPlot 是一款很棒的軟體,可以解決大量資料顯示問題,效能強悍。使用 MIT 開源授權,真香!
之前在網上只搜尋到 ScottPlot 介紹和使用的文章,沒有原始碼分析。今天我來寫一個 ScottPlot 原始碼分析,補充一下。
很少寫文章,發現寫原始碼分析的文章還挺難的,不足之處請見諒!希望大家喜歡!
最後,感謝 ScottPlot 的貢獻者們!