
术语“内存泄漏”和“ .NET 应用程序”不是经常一起使用。但是,我们最近在一个.NET Core Web 应用程序中出现了一系列内存不足异常。事实证明,此问题是由 Entity Framework Core 中的行为更改引起的,尽管最终的解决方案非常简单,但实现该目标的过程既充满挑战又有趣。
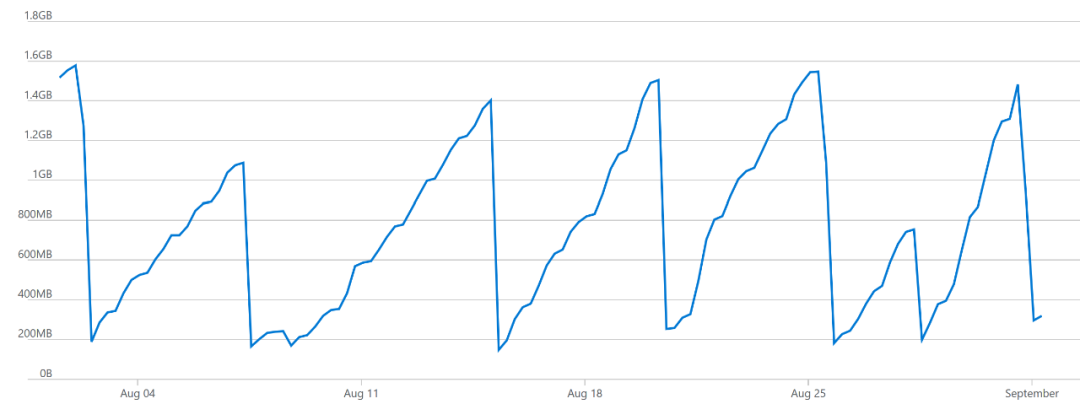
该系统本身托管在 Azure 中,由 Angular SPA 前端和后端的.NET Core API 组成,使用 Entity Framework Core 与 Azure SQL 数据库进行通信。作为专门从事.NET 开发的软件咨询公司,我们之前已经编写了许多类似的应用程序。因此,内存不足崩溃是无法预料的,因此我们立即知道这是需要认真对待的事情。使用 Azure 门户中的指标,我们可以看到内存使用率稳步上升,然后突然下降:此下降是应用程序崩溃。
因此,我们花了一些时间进行调查并逐步进行更改,以解决看似经典的内存泄漏问题。.NET 泄漏的常见原因是未正确处理某些问题,在我们的案例中很可能是 EF Core 数据库上下文。因此,我们遍历了源代码,以寻找可能无法处理上下文的潜在原因。这变成了空白。
我们将 Entity Framework Core 升级到了最新版本,因为最近的更新包括各种内存泄漏的修复程序和总体效率的提高。
我们还在使用的 Application Insights 版本中发现了可能的内存泄漏(请参阅https://github.com/microsoft/ApplicationInsights-dotnet/issues/594),因此我们也对该软件包进行了升级。
这些都不能解决问题,因此我们解剖了从 Azure 应用服务中获取的内存转储(请参阅https://blogs.msdn.microsoft.com/jpsanders/2017/02/02/how-to-get-a-full-memory-dump-in-azure-app-services/)。
我们注意到,绝大多数托管内存最终都由 MemoryCache 类使用。进一步深入研究表明,大多数缓存数据都是原始 SQL 查询的形式。我们看到大量的根本上是同一查询的事件被多次缓存,并且参数本身被硬编码在查询中而不是被参数化。
例如,与其像这样缓存查询:
SELECT TOP (1) UserId, FirstName, LastName, EmailAddress
FROM Users
WHERE UserId = @param_1
我们发现这样的多个查询:
SELECT TOP (1) UserId, FirstName, LastName, EmailAddress
FROM Users
WHERE UserId = 5
因此,我们进行了一些搜索,寻找可能与之相关的 EF 核心问题,并遇到了这个问题:https://github.com/aspnet/EntityFrameworkCore/issues/10535。
关于这个问题的主题指出了这个问题:我们正在建立一个动态表达式树,并使用它 Expressions.Expression.Constant 来为 where 子句提供参数。使用常量表达式意味着 Entity Framework Core 不会参数化 SQL 查询,并且是 Entity Framework 6 的行为更改。
我们到处都使用这个表达式树,通过它的 ID 来获取某些东西,这就是为什么它是一个很大的问题。
因此,这就是我们所做的更改:
// Before
var param = Expressions.Expression.Parameter(typeof(T));
Expression = Expressions.Expression.Lambda<Func<T, bool>>(
  Expressions.Expression.Call(
    Expressions.Expression.Constant(valuesToFilter),
    "Contains",
    Type.EmptyTypes,
    Expressions.Expression.Property(param, propertyName)),
  param);
// After
var param = Expressions.Expression.Parameter(typeof(T));
// This is what we added
Expression<Func<List<int>>> valuesToFilterLambda = () => valuesToFilter;
Expression = Expressions.Expression.Lambda<Func<T, bool>>(
  Expressions.Expression.Call(
    valuesToFilterLambda.Body,
    "Contains",
    Type.EmptyTypes,
    Expressions.Expression.Property(param, propertyName)),
  param);
使用 lambda 表达式获取表达式主体会使Entity Framework Core对 SQL 查询进行参数化,因此仅缓存它的一个实例。
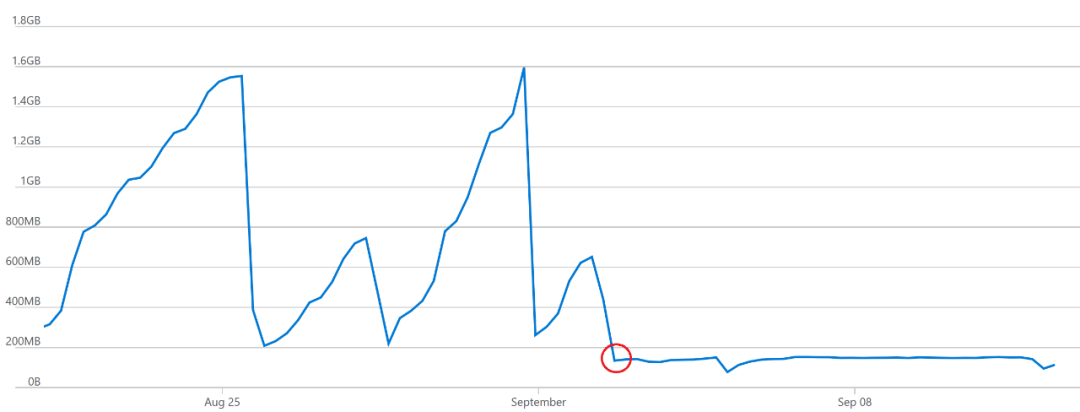
这是包括修订版本在内的一段时间内的内存使用情况。该版本以红色标记,您可以看到差异很大。稳定的内存使用量从未超过 200MB,而不断攀升至超过 1GB,然后发生崩溃。
最初进行调查时,真正的解决方案不是我们要注意的事情,而是通过检查内存转储并遵循证据我们最终到达那里。
从此调查中可以汲取的教训是:
- 内存转储不会说谎-如果内存泄漏,请先查看证据。
- 微软已经开放了 EF Core 的源代码,所有问题在那里所有人都可以看到,对有需求的开发者来说非常方便。
- 简单的代码更改(在这种情况下为一行)可能会产生巨大的影响。