
What is Data Tracking? What is the Significance of Setting Up Tracking?

What is Data Tracking? What is the Significance of Setting Up Tracking?

Tracking refers to collecting some information in specific processes within an application to track the usage of the application, which is later used to further optimize the product or provide data support for operations.

Last updated 4/24/2022 8:25 PM
MY少数派
10 min read
Category
Sharing
Tags
Architecture Design

So-called event tracking is the process of collecting information within specific flows of an application to monitor app usage. This data is subsequently used to further optimize the product or provide operational data support, including Visits, Visitors, Time on Site, Page Views, and Bounce Rate. Such information collection can be roughly divided into two types: page tracking (track this virtual page view) and behavioral action tracking (track this button by an event).

1. Key Metrics

Let's first look at the metrics that both apps and H5 pages focus on. Understanding the subtle differences and complexities of how these metrics are calculated allows us to think about the significance of event tracking from a different perspective. [Source: Mastering Web Analytics 2.0]

1.1 Visits and Visitors

Visits and Visitors are metrics that almost all applications need to track. They are the most fundamental metrics.

For application analytics, the goal is to track Visitors. Visits refer to the session layer – a user opens the app, spends some time browsing, and then leaves. By definition, this is called a session. A session (or Visit) is determined by the first request (opening the app) and the last request. If a user opens the app, puts down their phone or walks away from their computer, and takes no action for the next 30 minutes, the session automatically ends, counting as one visit or session period.

When calculating visitors, the data reported by event tracking should be as close to the actual number of users as possible. Regarding the metric of unique visitors, it's important to emphasize here that the number of unique visitors is not the actual number of unique individuals. Therefore, when collecting data, one must understand that although unique visitors can reflect the number of real visitors to an application quite well, it does not equal the actual number of people using the application.

This is because reinstalled applications or modified phone parameters can affect the unique visitor metric. Unique visitor tracking typically relies on cookies. When a user opens the app, the app creates a unique cookie on the user's device. While cookies are retained, they can still be manually cleared by users or disabled, leading to inconsistent cookies for the same user across different sessions. Hence, unique visitors can only be very close to the actual number of people using the application.

1.2 Time on Site

Time on site is used to measure the duration a user spends on a particular page or during a single visit (session).

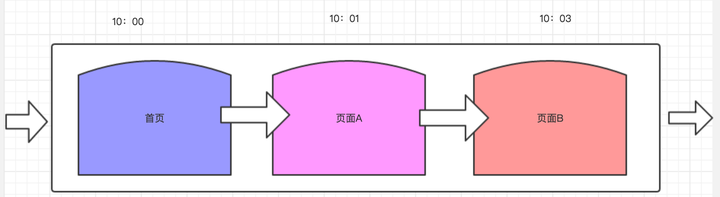
Page time on site represents the time spent on each page. For example, the homepage time is the duration from entering the homepage (10:00) to leaving the homepage and entering the next page (10:01), calculating a homepage time of 1 minute. Page A is 2 minutes. For Page B, the entry time is (10:03), but there is no recorded exit time; in this case, the calculation is 0. This special situation requires special attention in event tracking. Again, don't try to collect absolutely precise data; learn to use incomplete data flexibly.

Application time on site represents the duration spent during a single visit (session), calculated as the sum of all page view durations. Following the same process above, the application time on site would be 4 minutes.

1.3 Bounce Rate

There are many methods for calculating bounce rate across different companies. The most commonly used one is: the proportion of sessions consisting of a single page view. This scenario means a user visits, views only one page, and then leaves. Picture the user's mental state: they open the app, think "what is this?", and then close or even uninstall it. This scenario is quite frightening, which is why the bounce rate metric receives so much attention.

Bounce rate can be broken down into two levels: the overall application bounce rate, and the bounce rate for key landing pages, or even for search keywords. The bounce rate metric is highly actionable; by tracking it, you can directly identify issues with pages or keywords.

1.4 Exit Rate

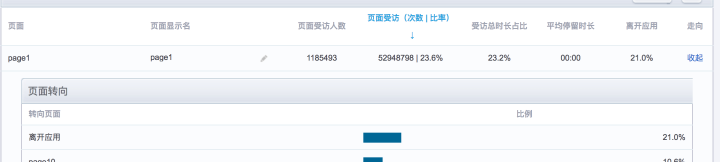
Exit rate is page-specific. The goal of this metric is simple: it shows how many users leave the application from a particular page. It is mainly used to indicate where users exit the application, helping to quickly identify which pages need improvement. (Note: in some processes designed to follow a standard flow, the page with the highest exit rate at the end of the standard flow might actually be a positive sign, so don't assume a high exit rate is always bad.)

1.5 Conversion Rate

We invest so much in our products, isn't it all to measure the output? So for e-commerce applications, is there any metric more worthy of attention than conversion rate? Conversion rate is calculated as some output divided by unique visitors or visits. For e-commerce products, this is typically the number of users who placed an order divided by unique visitors.

Calculating conversion rate may seem simple, but it is actually the most business-centric data collection in event tracking. It is also the metric that best demonstrates tracking skills, as the calculation method needs to be defined based on business characteristics. The basic conversion rate is orders placed / visitors. Conversion rate can also be broken down into levels, such as for specific user paths, e.g., orders completed along a specific path / visitors.

Try to think of a path: how do you think the conversion rate data is obtained? What kind of data does event tracking collect?

1.6 Engagement

Engagement is not a single metric but a series of metrics, such as visit depth and visit frequency. The reason for listing engagement as a metric is to encourage understanding that combining metrics can create synergistic effects and reveal the essence of things.

2. Methods of Data Event Tracking

There are currently two mainstream methods for event tracking:

  • First: The company's own R&D team injects tracking code into the product and builds a corresponding backend query system.
  • Second: Third-party tracking tools, such as Umeng, Baidu Mobile, Mofang, App Annie, talking data, etc.

If your data comes from the second method, then the tools you use should also be third-party analytics tools. There's not much to add regarding data products beyond making good use of these tools. Here, we'll discuss the first method: how to design data event tracking based on your own product's task flows and goals.

2.1 Frontend Event Tracking

Code-based event tracking has been around for a long time, existing since the era of Google Analytics. Currently, major domestic third-party data analytics service providers like Baidu Analytics, Umeng, TalkingData, etc., all offer code-based tracking solutions for mainstream platforms like iOS, Android, and Web. The principle is to initialize the data analytics SDK when the app or interface loads, and then call the SDK's data sending interface to send data whenever a specific event occurs. The industry sometimes boasts about "no-tracking" solutions, but this actually doesn't mean no tracking at all; it means no manual tracking is required. In reality, once the SDK is integrated, data collection happens continuously. If you're interested, reading the provided SDK documentation will give you a better understanding of frontend tracking and the information collected. This area is also constantly evolving, as discussed in The Story of Statistical Event Tracking.

2.2 Backend Event Tracking

Backend event tracking, also known as server-side tracking, involves not only logging interface requests but also adding parameters to the interface to pass information layer by layer, thereby linking the data chain. Because it relies on interface modifications, it is typically used to supplement statistics that cannot be achieved with frontend tracking alone. Most in-house data statistics systems use a combination of frontend and backend tracking.

3. Content of Event Tracking

After reviewing these key metrics, have you noticed that the sources of event tracking can be broadly divided into two parts: one part is tracking application page views – page tracking; the other part is tracking operational behavior within the application – custom event tracking.

Data is generated every time a page view occurs or an event like a click or swipe happens. Each event reports a piece of data, including page information, control information, device information, user information, etc. To link user behaviors together, it is essential to ensure a globally unique ID that connects the sequence of visits.

Subsequent statistics simply need to link the user's behavior flow and calculate the desired results.

4. Notes on Event Tracking Data

  • Do not pursue perfection excessively

One crucial point about event tracking data: tracking is meant to better utilize data. Do not try to obtain precise data; instead, aim for high-quality tracking data. The earlier discussion about bounce rate is an example. Get the data you can, use imperfect data to drive next steps, and pursue quality, not precision. This is a common pitfall for many data products, so remind yourself of this frequently.

5. References:

Keep Exploring

Related Reading

More Articles