
1. 概要
开发过程中避免不了调试和日志输出使用 Trace 对象无论在 debug 模式下和 release 模式运行的程序都可以进行实时跟踪(vs 运行程序时 debugview 是监控不到的直接双击 exe 运行监控即可),顺便来测试一下在.NET8 中基于 AOT 发布和普通模式下发布应用使用 DebugView 工具查看 Trace.Write 输出调试信息。
2. Debugview
Debugview 是一个应用程序,支持你监视本地系统上或可通过 TCP/IP 访问的网络上任何计算机上的调试输出。 它可以同时显示内核模式和 Win32 调试输出,因此无需调试器来捕获应用程序或设备驱动程序生成的调试输出,也无需修改应用程序或驱动程序以使用非标准调试输出 API。
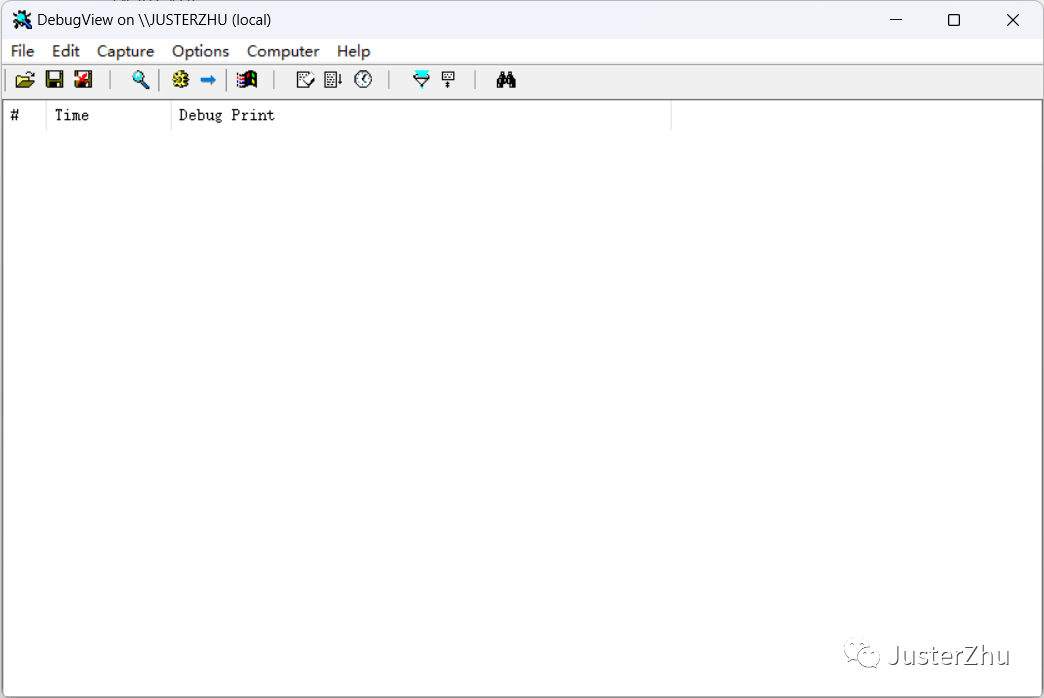
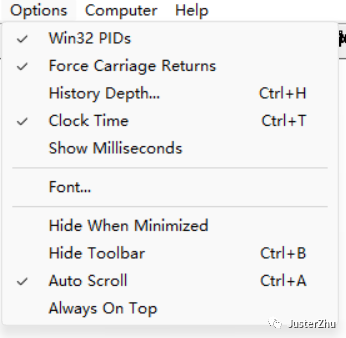
使用非常简单,用管理员的身份启动之后把 Options 里的这几项勾选即可(当我们写的.NET 程序运行之后会自动捕捉输出的消息内容)。
3. 测试代码
using System.Diagnostics;

namespace TraceAOT
{
   internal class Program
  {
       static void Main(string[] args)
      {
           //指定Trace输出的日志文件名
           Trace.Listeners.Add(new TextWriterTraceListener("MyTraceListeners"));
           for (int i = 0; i < 10; i++)
          {
               Thread.Sleep(1000);
               //在满足前面的表达式时输出,Trace信息。(同时也向Listeners添加信息。)
               Trace.WriteLineIf(i==5, "Trace message.");
          }
           //Flush完成本次输出
           Trace.Flush();
           Console.WriteLine("OK");
           Console.Read();
      }
  }
}
4. 测试结果
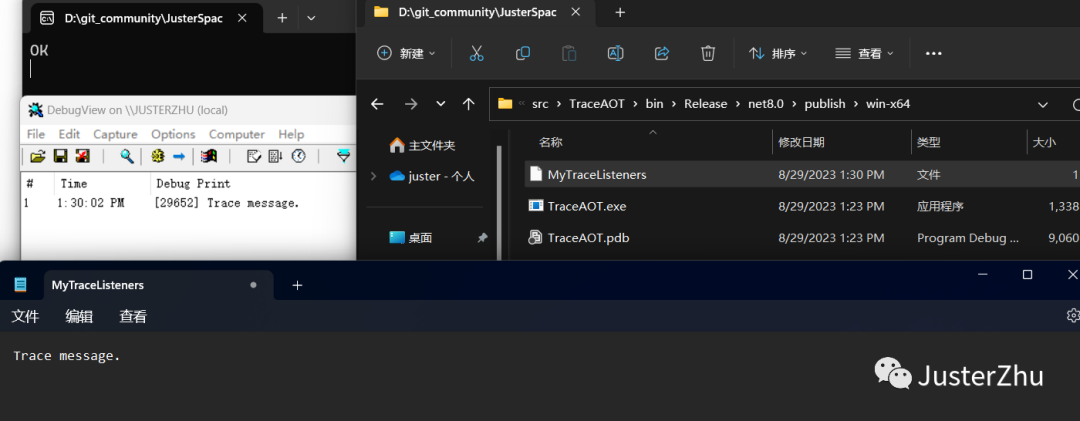
5. 结论
DebugView 工具在基于.NET 8 无论是 AOT 或普通发布应用程序都是可以正常的使用,Trace 对象无论在 debug 模式下和 release 模式运行的程序都可以进行实时跟踪极大的简化了我们追踪调试的过程。