

作为一名程序员,就算你拥有大圣的 72 变,依然逃脱不了观音的紧箍咒;程序出 Bug 已是家常便饭,但解决问题的能力更加凸现你在公司的地位。本文结合自身实战经验,梳理日常开发中神一般的调试技巧。希望对各位大佬有所参考和借鉴,如有错误的地方,还请指正。
作者介绍
大家好,我是河畔一角,一名老前端,平常工作比较忙,文章不经常发布,也希望每次的梳理都能给各路朋友带来帮助。
前端小白
我曾出过不少课程,学生群也有十几个了,我遇到太多的学生了,一遇到问题,就在群里直接@我:我页面出不来了,快帮我看看 我代码跟你一样,就是不行 控制台报错,怎么办? 怎么打断点 代码怎么调试?
说实话,很无奈,我也特别能理解他们,刚毕业,就像一张白纸一样,没有工作经验,他们对这个行业的认知还处于低位,所以每当遇到问题的时候,一方面是帮助他们排查问题,另一方面也希望帮他们逐步培养他们自主解决问题的能力和方法。
前端菜鸟
console 大法
这个大家肯定不陌生了,遇到问题,可以通过 console 来输出日志,分析问题。
- console.log()
普通日志输出,也是前端使用频次最高的打印方法
function Person() {
this.name = "jack";
this.age = 30;
}
let person = new Person();
// 查看person对象都有哪些属性和方法
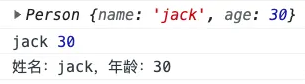
console.log(person);
// 可以同时姓名和年龄
console.log(person.name, person.age);
// 也可以使用占位符进行输出
console.log("姓名:%s,年龄:%d", person.name, person.age);
输出如下:
模板字符串肯定比占位符要更简单,此处不展开讨论。
- console.warn()
用于控制台输出警告信息。同console.log用法一样,只是样式显示不同,通过 warn 方法输出,前面会显示黄色警告标志。
输出如下:

- console.info()
用于控制台输出说明信息。同 console.log 用法一样,样式也相同。
输出如下:

- console.error()
用于控制台输出错误信息。同console.log用法一样,只是样式显示不同,通过 error 方法输出,前面会显示错误图标。
输出如下:

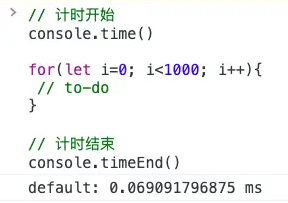
- console.time()
如果想要获取一段代码执行时间,可使用 console.time() 进行计时,使用 console.timeEnd() 结束计时。
// 计时开始
console.time();

for (let i = 0; i < 1000; i++) {
  // to-do
}

// 计时结束
console.timeEnd();
输出如下:
注意:
console.timeEnd()不可以单独使用,必须先定义console.time()否则,会提示:VM578:1 Timer 'default' does not exist
- console.count()
如果想要获取代码执行次数,可使用 console.count()。
for (let i = 0; i < 5; i++) {
  // 次数统计
  console.count();
}
输出如下:

也可以传入一个参数,进行标记,比如: console.count('次数:')
以上是关于通过 console 打印来做调试的比较常用的几个方法,当然还有不少,比较冷门和低频的就不一一列举了。
debugger
除了 console 日志打印外,比较常用的就是 debugger 了,当程序出错或者找不到问题时,我们需要在代码中直接定义 debugger 来暂停程序执行,进而分析问题。
js 复制代码 let list = [{ name:'jack' , age: 30 , info:{ score: 70} },{ name:'tom' , age: 28 }]
for (let item of list) {
  debugger;
  if (item.info.score > 60) {
    console.log(`恭喜你:${item.name}`);
  }
}
上述代码很明显会报错,如果程序再复杂一些,就需要我们断点调试了。通过 debugger,我们可以调试得知 item.info 为 null 导致程序报错。
调试如下:

chrome 断点
无论是在代码中写 console.log 还是 debugger 都是一种侵入式断点,解决问题以后,还需要手工清除,殊不知,浏览器本身也可以打断点?
以 Vue3 为例,我们打开控制台,找到源代码,通过 ctrl + p 搜索用户管理菜单文件 User.vue ,在想要断点的地方,直接点击即可生成断点。

如果不小心打了一堆断点,如何快速清除?

进入断点以后,鼠标悬浮在变量上,会显示该变量值,悬浮在对象上会显示对象下的属性和方法,右侧面板包含:监视区、断点、作用域、调用堆栈等板块。

chrome 添加带条件断点
如果我们调试的代码是一个循环,可能我们要一条一条执行,直到条件成立时,才能查看对应的变量值,殊不知太浪费时间,也是一种太笨的方法?
- 找到要调试的代码片段

- 右键选择条件断点

- 当 userId == 1000002 时,才触发断点

- 当条件成立时才会触发断点

条件断点,简直太好用了,爆赞

前端王者
请求重发
跟后端接口调试时,页面请求太快,后端来不及看日志,于是后端会让前端:再发一次请求,我调试一下 ,于是我们傻乎乎的,就刷新了一下页面,殊不知浏览器自带请求重发?
操作步骤:
- 打开控制台
- 选择 Network(中文叫网络)
- 找到要重发的接口
- 右键选择 Replay XHR(中文叫重放 XHR)
于是你就看到了惊人的一幕,请求再次发送了...
请求重放前:

请求重放后:

控制台发送请求
如果请求重发的时候,需要修改参数,如何处理?
- 打开控制台
- 选择 Network(中文叫网络)
- 找到要修改参数的接口
- 右键选择 Copy -> Copy as fetch (中文叫以 fetch 格式复制)
- 在控制台界面,粘贴
- 修改请求参数,直接回车即可
- 复制请求

- 修改分页参数为第二页:
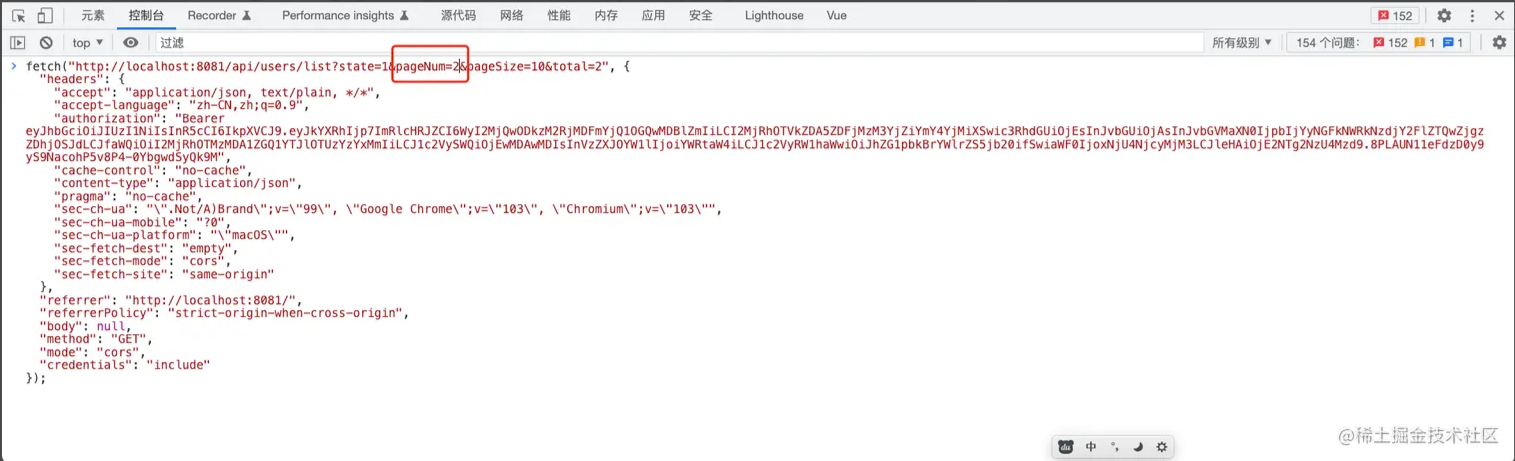
- 回车发送请求

HTML 节点复制
当页面布局出问题时,我们往往需要通过审查元素进行分析,同时也会在控制台通过 DOM API 来进行读写调试,但是 DOM API 操作起来过于麻烦,殊不知浏览器已自带 api 功能?
- 当选中要查看的
html节点时,会自动生成$0变量
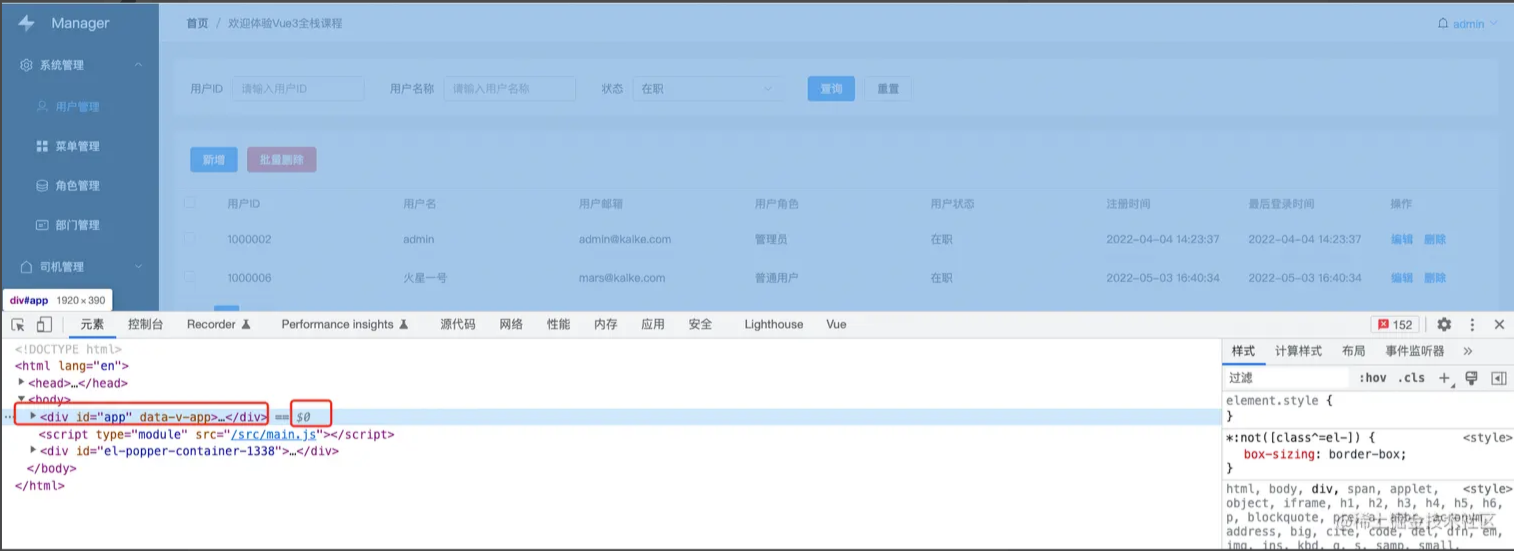
- 控制台直接写
$0便会打印选中的节点
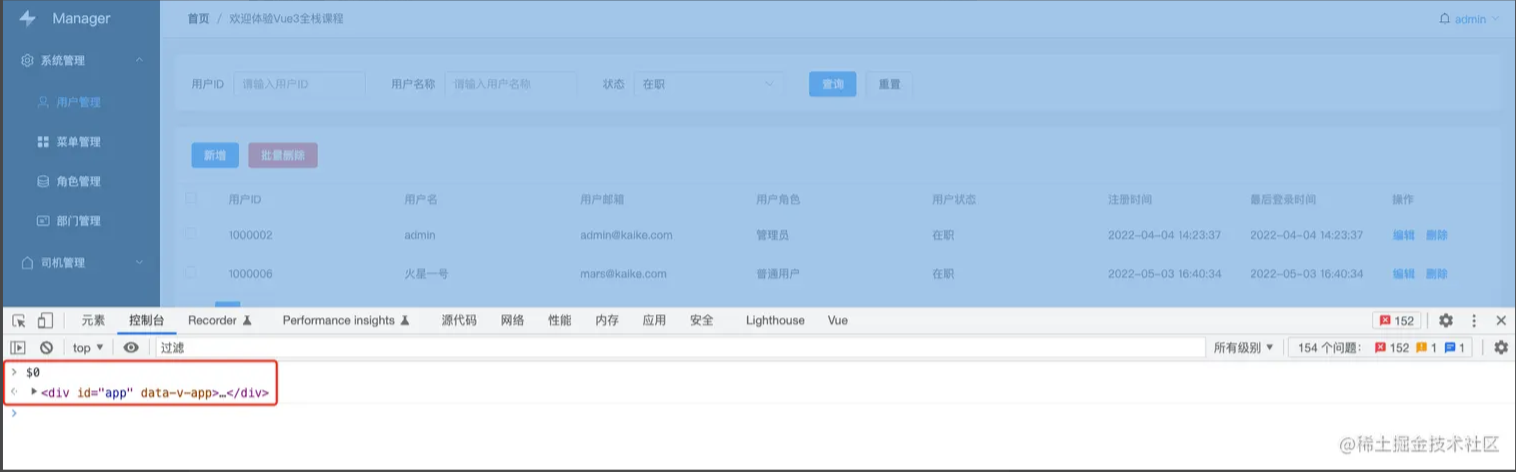
- 用
$或$$代替docuement.querySelector()

这简直太好用了,如果你还不知道,真的就
out了,chrome太懂前端了
JavaScript 对象复制
有时候我们通过 console.log 打印了一个比较复杂的对象,但是需要一层一层展开进行查看,非常不方便,有什么好办法?
function Person() {
  this.name = "jack";
  this.age = 30;
}

let person = new Person();

// 查看person对象都有哪些属性和方法
console.log(person);
浏览器自带 copy 函数
1. 输入 copy(person)`

- 直接粘贴
控制台会直接格式化打印改对象,不再需要一层一层展开,是不是贼方便。
更多好用变量如下:
$// 简单理解就是 document.querySelector 而已。$$// 简单理解就是 document.querySelectorAll 而已。$_// 是上一个表达式的值$0-$4// 是最近 5 个 Elements 面板选中的 DOM 元素,待会会讲。dir// 其实就是 console.dirkeys// 取对象的键名, 返回键名组成的数组values// 取对象的值, 返回值组成的数组
本地文件替换远程
我曾经遇到过一种场景,有一个项目已经部署到服务器上了,但是本地没有仓库代码,服务器全部是压缩的代码,我们要调试变得很困难,普通的做法就是下载服务器的压缩包到本地,通过 nginx 运行,进行本地调试,最后修改压缩包再重新部署到服务器。殊不知浏览器已经提供了 overrides 功能?
打开控制台
选择源代码,点击替换

点击+选择一个文件夹(可以在桌面随便创建一个文件)
点击同意

刷新页面
选择网络,选择要修改的文件(
css或js),右键选择:保存并覆盖

- 此时可以看到该远程文件已经被下载到本地对应文件夹中

- 直接在文件中修改代码,页面会同步修改
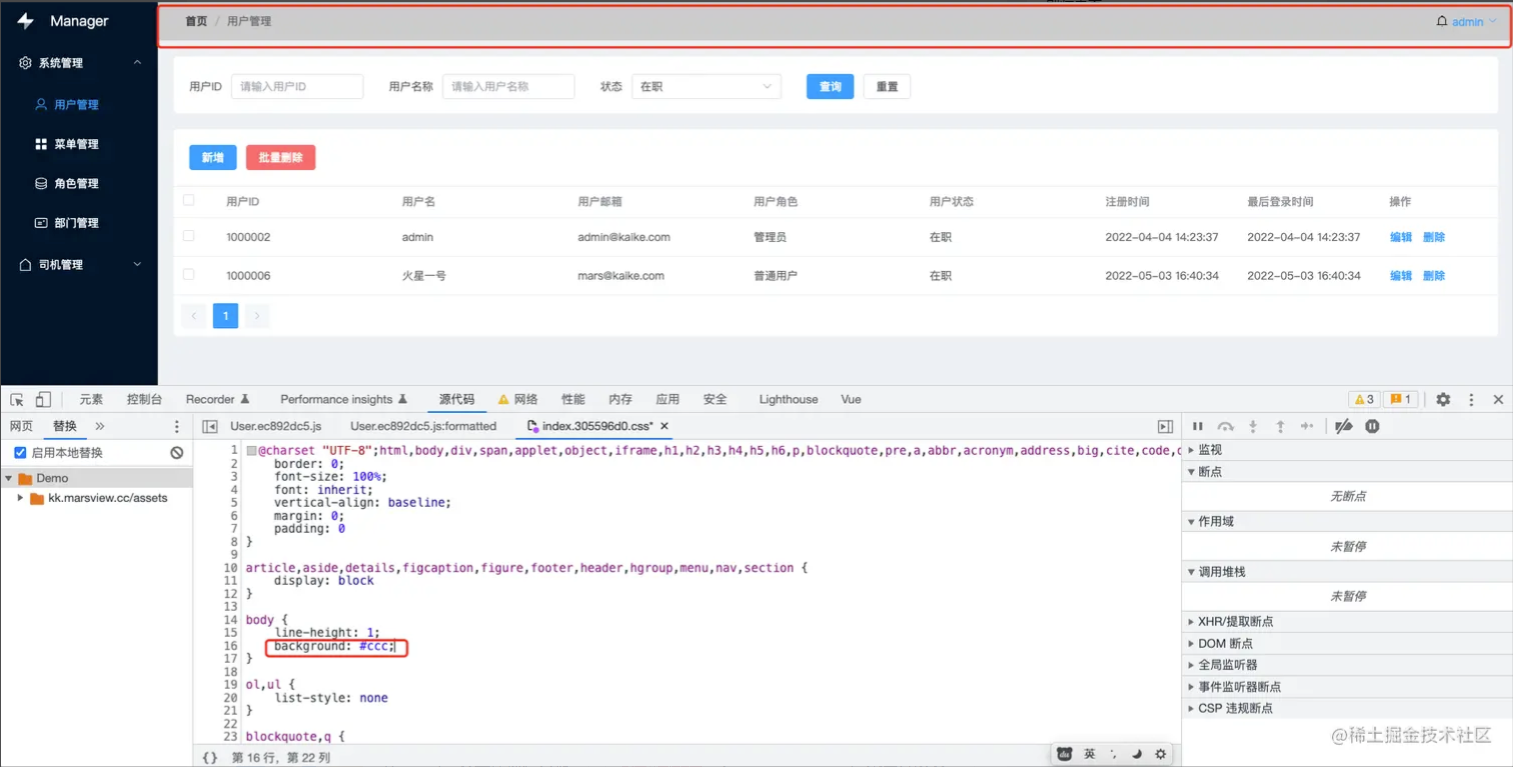
修改完以后,直接保存
把本地文件重新部署到远程服务器即可。
以上就是本次给大家整理的各种调试能力,希望大家喜欢,我是河畔一角。